Splitting the work between the Figure and the Axes
Fill in the blanks · Basic · §2.2 How Figure, Axes, and Axis fit together
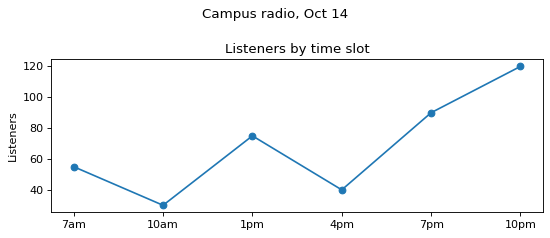
Draw a line chart of the campus radio station's listeners by time slot and save it to a file. In the five blanks, write the name of the object that receives each command. Commands that change the whole figure go to fig, and commands that change the one chart area where the line is drawn go to ax.
Code with blanks
import matplotlib.pyplot as plt

slots = ["7am", "10am", "1pm", "4pm", "7pm", "10pm"]
listeners = [55, 30, 75, 40, 90, 120]

fig, ax = plt.subplots(figsize=(7, 3))
____.plot(slots, listeners, marker="o")     # draw the line
____.set_title("Listeners by time slot")    # chart title
ax.set_ylabel("Listeners")
____.suptitle("Campus radio, Oct 14")      # figure title
____.tight_layout()                        # tidy the margins
____.savefig("radio.png", dpi=100)         # save to a file
plt.show()
Solve this problem in your browser
Python runs in your browser and checks your answer right away. Hints and the answer are on the problem page.