Code that imports pyplot the wrong way
Code review · Basic · §2.1 Matplotlib and setup
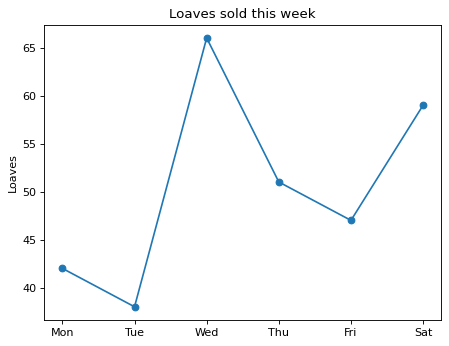
This code draws a line chart of loaf sales, but it stops with an error as soon as it runs. Fix one line so that it draws a line chart with the title Loaves sold this week and the y-axis label Loaves.
Code to fix
import matplotlib as plt

days = ["Mon", "Tue", "Wed", "Thu", "Fri", "Sat"]
loaves = [42, 38, 66, 51, 47, 59]

fig, ax = plt.subplots()
ax.plot(days, loaves, marker="o")
ax.set_title("Loaves sold this week")
ax.set_ylabel("Loaves")
plt.show()
Solve this problem in your browser
Python runs in your browser and checks your answer right away. Hints and the answer are on the problem page.