Cafe wait times compared by mean and median
Write code · Medium · §8.1 Differences the average hides
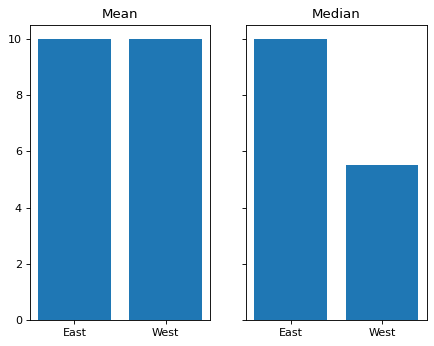
Lunchtime order wait times (minutes) at two campus cafes, East and West, were measured six times each and stored in the DataFrame waits. Make two Axes in 1 row and 2 columns that share the y-axis, and draw bar charts of the mean for each cafe on the left Axes and the median for each cafe on the right Axes.
The bars are in the order East, West, and the titles are Mean on the left and Median on the right. Grading redraws the charts with different wait times and numbers of measurements.
Starter code
import matplotlib.pyplot as plt
import pandas as pd

cafes = ["East"] * 6 + ["West"] * 6
minutes = [9, 10, 10, 11, 12, 8, 4, 5, 5, 6, 7, 33]
waits = pd.DataFrame({"cafe": cafes, "minutes": minutes})

# Write your code here
Solve this problem in your browser
Python runs in your browser and checks your answer right away. Hints and the answer are on the problem page.