Charts for comparison and trend questions
Fill in the blanks · Basic · §1.1 Visualization answers questions
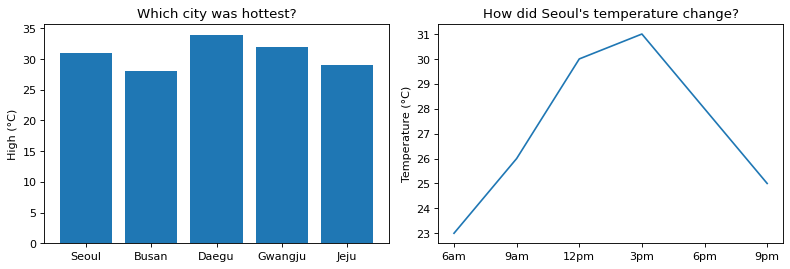
Using temperature data from one summer day, draw two charts side by side that answer two questions. The left chart (ax1) compares five cities to show which was hottest, and the right chart (ax2) shows how the temperature in Seoul changed over that day.
In each of the two blanks, write the drawing command that fits the question. Draw a bar chart with bar(x values, bar heights) and a line chart with plot(x values, y values).
Code with blanks
import matplotlib.pyplot as plt

cities = ["Seoul", "Busan", "Daegu", "Gwangju", "Jeju"]
high = [31, 28, 34, 32, 29]              # daytime high by city (°C)
hours = ["6am", "9am", "12pm", "3pm", "6pm", "9pm"]
seoul = [23, 26, 30, 31, 28, 25]         # temperature in Seoul by time of day (°C)

fig, (ax1, ax2) = plt.subplots(1, 2, figsize=(10, 3.5))
ax1.____
ax1.set_title("Which city was hottest?")
ax1.set_ylabel("High (°C)")
ax2.____
ax2.set_title("How did Seoul's temperature change?")
ax2.set_ylabel("Temperature (°C)")
fig.tight_layout()
plt.show()
Solve this problem in your browser
Python runs in your browser and checks your answer right away. Hints and the answer are on the problem page.