Charts for distribution and relationship questions
Fill in the blanks · Basic · §1.1 Visualization answers questions
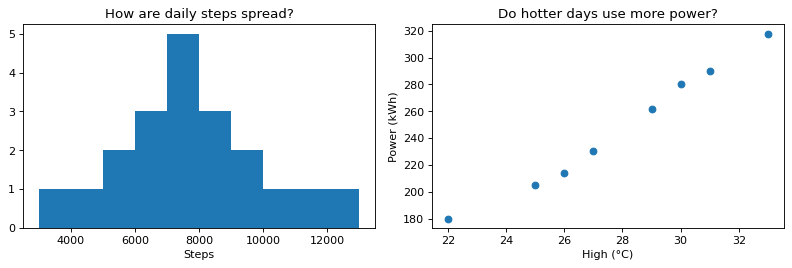
Draw two charts side by side that answer two questions. The left chart (ax1) shows how daily steps over 20 days are spread out, and the right chart (ax2) shows whether the dorm uses more power on days with a higher daytime high.
In each of the two blanks, write the drawing command that fits the question. Draw a histogram with hist(list of values) and a scatter plot with scatter(x values, y values). On the scatter plot, put the temperature temp on the x-axis and the power use power on the y-axis.
Code with blanks
import matplotlib.pyplot as plt

steps = [7300, 5200, 8800, 6100, 9700, 7600, 3000, 8100, 6900, 7900, 10300, 6400, 7000, 8500, 4500, 9200, 7500, 13000, 5800, 11400]
temp = [22, 25, 27, 29, 31, 33, 30, 26]                # daytime high (°C)
power = [180, 205, 230, 262, 290, 318, 280, 214]       # dorm power use that day (kWh)

fig, (ax1, ax2) = plt.subplots(1, 2, figsize=(10, 3.5))
ax1.____
ax1.set_title("How are daily steps spread?")
ax1.set_xlabel("Steps")
ax2.____
ax2.set_title("Do hotter days use more power?")
ax2.set_xlabel("High (°C)")
ax2.set_ylabel("Power (kWh)")
fig.tight_layout()
plt.show()
Solve this problem in your browser
Python runs in your browser and checks your answer right away. Hints and the answer are on the problem page.