An AI draft that needs one color and a unit
Code review · Basic · §1.5 Checking an AI draft
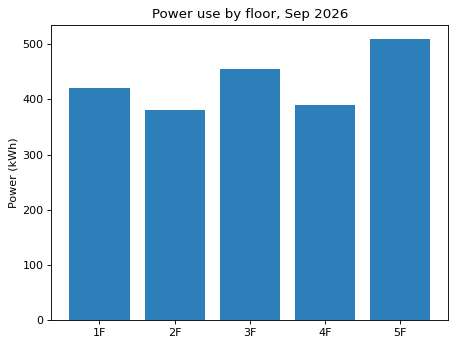
This is a draft bar chart of dorm power use by floor that an AI drew. Each bar has a different color, but the colors do not distinguish anything, and the y-axis does not say what was measured or in what unit.
Fix one line and add one line so that every bar uses the single color #2C7FB8 and the y-axis has the label Power (kWh).
Code to fix
import matplotlib.pyplot as plt

floors = ["1F", "2F", "3F", "4F", "5F"]
kwh = [420, 380, 455, 390, 510]

# AI draft
fig, ax = plt.subplots()
ax.bar(floors, kwh, color=["red", "orange", "green", "purple", "pink"])
ax.set_title("Power use by floor, Sep 2026")
plt.show()
Solve this problem in your browser
Python runs in your browser and checks your answer right away. Hints and the answer are on the problem page.