An AI draft that cuts the y-axis at 40
Code review · Basic · §1.5 Checking an AI draft
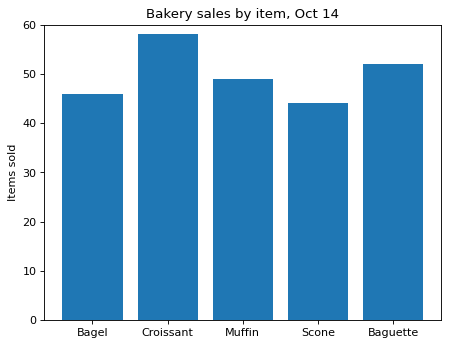
You asked an AI to draw a bar chart of a bakery's sales by item, and it gave you this draft. The y-axis starts at 40, so the differences between the bars look bigger than they really are, and the title adds a judgment that is not in the data.
Fix two lines so that the y-axis shows 0 to 60 and the title becomes Bakery sales by item, Oct 14, which states what was measured and when.
Code to fix
import matplotlib.pyplot as plt

items = ["Bagel", "Croissant", "Muffin", "Scone", "Baguette"]
sold = [46, 58, 49, 44, 52]

# AI draft
fig, ax = plt.subplots()
ax.bar(items, sold)
ax.set_ylim(40, 60)
ax.set_title("Croissants crush the competition!")
ax.set_ylabel("Items sold")
plt.show()
Solve this problem in your browser
Python runs in your browser and checks your answer right away. Hints and the answer are on the problem page.