Axes methods that match plt commands
Fill in the blanks · Basic · §2.3 Two ways to make a chart
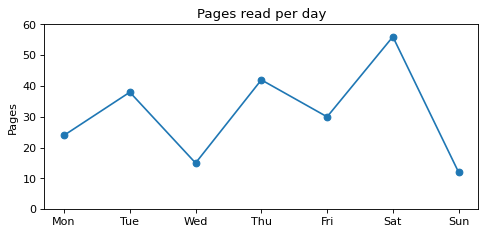
Draw a line chart of the number of pages read each day for one week. Convert the plt style commands written in the comments, one by one, into Axes methods to make the same chart. Fill in the five blanks with the matching Axes method names and arguments.
Code with blanks
import matplotlib.pyplot as plt

days = ["Mon", "Tue", "Wed", "Thu", "Fri", "Sat", "Sun"]
pages = [24, 38, 15, 42, 30, 56, 12]

# plt style
# plt.figure(figsize=(7, 3))
# plt.plot(days, pages, marker="o")
# plt.title("Pages read per day")
# plt.ylabel("Pages")
# plt.ylim(0, 60)
# plt.show()

fig, ax = plt.subplots(figsize=(7, 3))
ax.____(days, pages, marker="o")
ax.____("Pages read per day")
ax.____("Pages")
ax.____(____)
plt.show()
Solve this problem in your browser
Python runs in your browser and checks your answer right away. Hints and the answer are on the problem page.