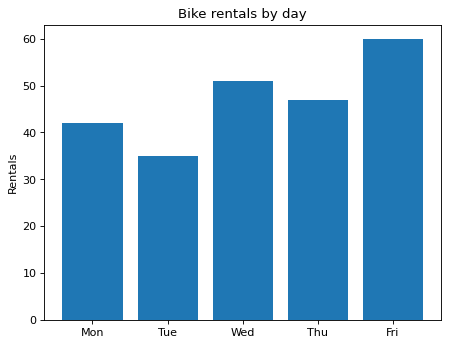
A bar chart of rentals by day
Write code · Basic · §2.4 Finishing and saving a single chart
Draw a bar chart of the number of rentals by day at a bike rental station. Put days on the x-axis and use rentals as the bar heights. You can create the Figure and the Axes with fig, ax = plt.subplots() and draw on them. If you draw in the plt style and get the same figure, that passes too.
Set the title to Bike rentals by day and the y-axis label to Rentals.
Starter code
import matplotlib.pyplot as plt

days = ["Mon", "Tue", "Wed", "Thu", "Fri"]
rentals = [42, 35, 51, 47, 60]

# Write your code here
Solve this problem in your browser
Python runs in your browser and checks your answer right away. Hints and the answer are on the problem page.