Argument order hidden behind an error
Code review · Medium · §2.5 Converting code and checking for errors
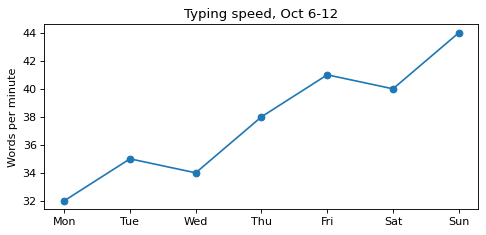
This code draws a line chart of typing speed (words typed per minute) measured every day for a week, but it stops with an error. After you fix the line with the error, keep looking at the figure and check, one by one, the object each command goes to, the method names, and the order of the arguments.
Fix two lines so that the code draws a line chart with the days on the x-axis and the typing speed on the y-axis, plus the Axes title Typing speed, Oct 6-12 and the y-axis label Words per minute.
Code to fix
import matplotlib.pyplot as plt

days = ["Mon", "Tue", "Wed", "Thu", "Fri", "Sat", "Sun"]
wpm = [32, 35, 34, 38, 41, 40, 44]

fig, ax = plt.subplots(figsize=(7, 3))
ax.plot(wpm, days, marker="o")
fig.set_title("Typing speed, Oct 6-12")
ax.set_ylabel("Words per minute")
plt.show()
Solve this problem in your browser
Python runs in your browser and checks your answer right away. Hints and the answer are on the problem page.