Errors made while converting from the plt style
Code review · Basic · §2.5 Converting code and checking for errors
This code charts an app's weekly downloads. Mistakes crept in while it was being converted from the plt style to the fig, ax style, and now it stops with an error when it runs.
Fix two lines so that the code draws a line chart with the title Weekly app downloads, the x-axis label Week, and the y-axis label Downloads.
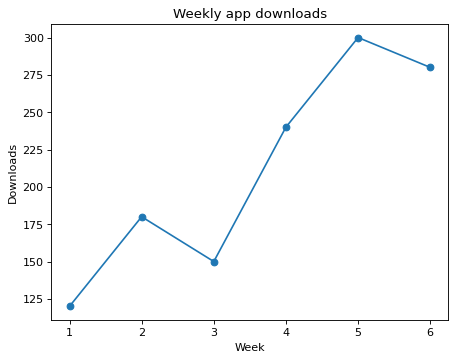
Code to fix
import matplotlib.pyplot as plt

weeks = [1, 2, 3, 4, 5, 6]
downloads = [120, 180, 150, 240, 300, 280]

fig, ax = plt.subplots()
ax.plot(weeks, downloads, marker="o")
ax.title("Weekly app downloads")
ax.xlabel("Week")
ax.set_ylabel("Downloads")
plt.show()
Solve this problem in your browser
Python runs in your browser and checks your answer right away. Hints and the answer are on the problem page.