A day's records on 2×2 Axes
Fill in the blanks · Basic · §3.2 Arranging and reaching Axes
Draw four kinds of hourly library records on Axes in 2 rows and 2 columns. Fill in the three blanks so that, starting at the top left and going along each row, the charts appear in this order: loans as a line, returns as a line, visitors as bars, and seats (seats used) as bars.
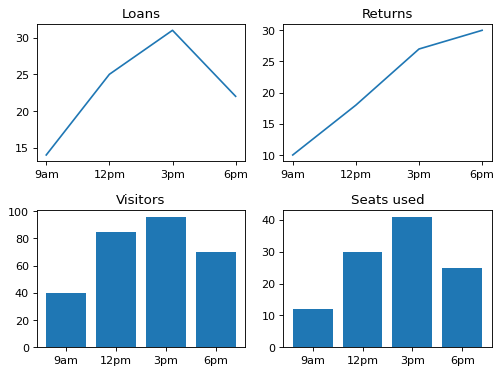
Code with blanks
import matplotlib.pyplot as plt

hours = ["9am", "12pm", "3pm", "6pm"]
loans = [14, 25, 31, 22]
returns = [10, 18, 27, 30]
visitors = [40, 85, 96, 70]
seats = [12, 30, 41, 25]

fig, axes = plt.subplots(____)
axes[0, 0].plot(hours, loans)
____.plot(hours, returns)
____.bar(hours, visitors)
axes[1, 1].bar(hours, seats)

titles = ["Loans", "Returns", "Visitors", "Seats used"]
for ax, title in zip(fig.axes, titles):
    ax.set_title(title)
fig.tight_layout()
plt.show()
Solve this problem in your browser
Python runs in your browser and checks your answer right away. Hints and the answer are on the problem page.