Four charts for four questions
Write code · Medium · §3.2 Arranging and reaching Axes
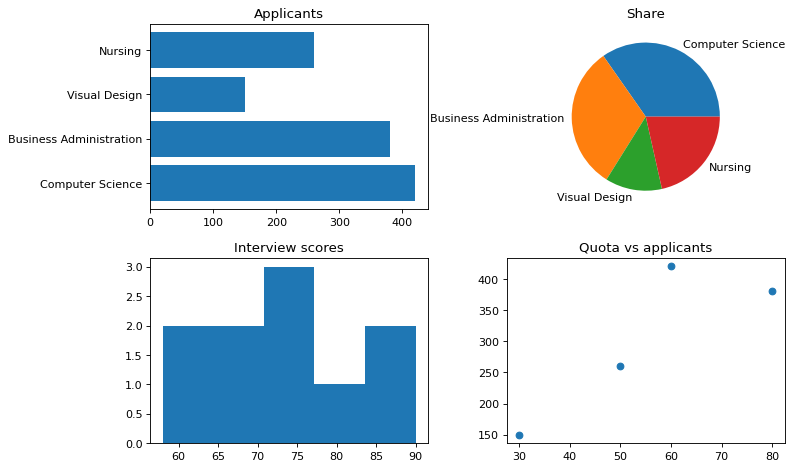
Draw a university's application data by department as four different charts on Axes in 2 rows and 2 columns. For each one, choose the plotting method that fits the question.
At the top left, draw a horizontal bar chart of applicants to compare the number of applicants by department. The department names in depts are long, so horizontal bars are easier to read. Keep the bars in the order barh() draws them: pass depts as it is, without reversing it or flipping the y-axis. The title is Applicants.
At the top right, draw a pie chart of each department's share of all applicants, and label each wedge with the department name. The title is Share.
At the bottom left, draw the distribution of interview scores, scores, as a histogram with 5 bins. The title is Interview scores.
At the bottom right, draw a scatter plot with the admission quota, quota, on the x-axis and the number of applicants, applicants, on the y-axis. The title is Quota vs applicants.
Starter code
import matplotlib.pyplot as plt

depts = ["Computer Science", "Business Administration", "Visual Design", "Nursing"]
applicants = [420, 380, 150, 260]
quota = [60, 80, 30, 50]
scores = [58, 63, 66, 70, 72, 75, 77, 81, 84, 90]

# Write your code here
Solve this problem in your browser
Python runs in your browser and checks your answer right away. Hints and the answer are on the problem page.