A power figure with a missing left line
Code review · Medium · §3.5 Putting it together and checking for errors
This code draws hydropower output (GWh) and the reservoir level (%) side by side in 1 row and 2 columns. It runs without errors, but no line shows up on the left Axes.
Fix one line so that the two Axes share only the x-axis, lined up by month, and keep separate y-axis ranges: 0 to 300 on the left and 0 to 100 on the right.
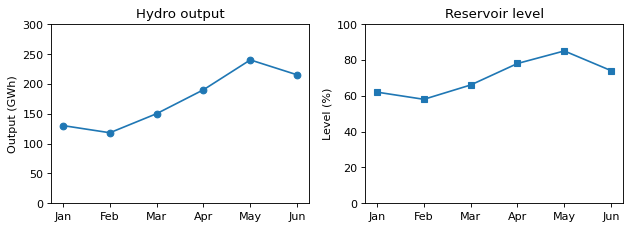
Code to fix
import matplotlib.pyplot as plt

months = ["Jan", "Feb", "Mar", "Apr", "May", "Jun"]
hydro = [130, 118, 150, 190, 240, 215]
reservoir = [62, 58, 66, 78, 85, 74]

fig, axes = plt.subplots(1, 2, sharey=True, figsize=(8, 3))
axes[0].plot(months, hydro, marker="o")
axes[0].set(title="Hydro output", ylabel="Output (GWh)", ylim=(0, 300))
axes[1].plot(months, reservoir, marker="s")
axes[1].set(title="Reservoir level", ylabel="Level (%)", ylim=(0, 100))
fig.tight_layout()
plt.show()
Solve this problem in your browser
Python runs in your browser and checks your answer right away. Hints and the answer are on the problem page.