A 2×2 club membership figure that stops with an error
Code review · Medium · §3.5 Putting it together and checking for errors
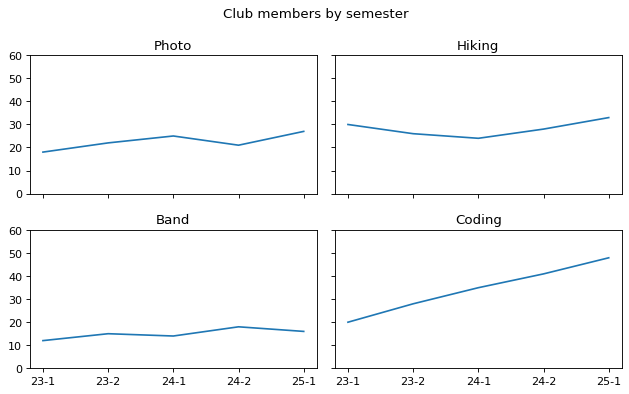
This code draws the number of members of four clubs by semester on Axes in 2 rows and 2 columns. To compare club sizes on the same scale, all four Axes share both the x-axis and the y-axis, and the y-axis range of 0 to 60 is set only once, on the top left Axes.
When you run it, it stops with an error. Read the error message and fix two lines. Starting at the top left and going along each row, the lines for the Photo, Hiking, Band, and Coding clubs should appear in that order, and the figure title Club members by semester should be added.
Code to fix
import matplotlib.pyplot as plt

terms = ["23-1", "23-2", "24-1", "24-2", "25-1"]
photo = [18, 22, 25, 21, 27]
hiking = [30, 26, 24, 28, 33]
band = [12, 15, 14, 18, 16]
coding = [20, 28, 35, 41, 48]

fig, axes = plt.subplots(2, 2, sharex=True, sharey=True, figsize=(8, 5))
axes[0, 0].plot(terms, photo)
axes[0, 0].set_title("Photo")
axes[0, 1].plot(terms, hiking)
axes[0, 1].set_title("Hiking")
axes[1].plot(terms, band)
axes[1, 0].set_title("Band")
axes[1, 1].plot(terms, coding)
axes[1, 1].set_title("Coding")
axes[0, 0].set_ylim(0, 60)
fig.set_title("Club members by semester")
fig.tight_layout()
plt.show()
Solve this problem in your browser
Python runs in your browser and checks your answer right away. Hints and the answer are on the problem page.