Two bar charts that share the y-axis
Write code · Medium · §3.3 Shared axes and fair comparisons
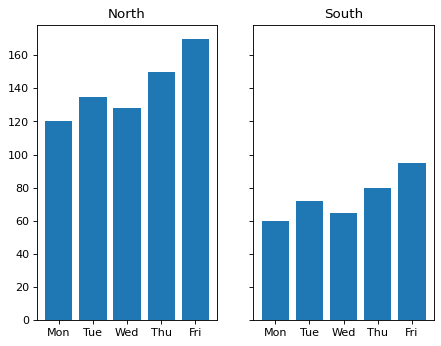
Draw the coffee sales of two cafes for each day of the week as bar charts side by side on Axes in 1 row and 2 columns. Draw north on the left Axes and south on the right Axes, and title them North and South.
Make the two Axes share the y-axis so that you can compare the bar heights of the two cafes fairly by eye.
Starter code
import matplotlib.pyplot as plt

days = ["Mon", "Tue", "Wed", "Thu", "Fri"]
north = [120, 135, 128, 150, 170]
south = [60, 72, 65, 80, 95]

# Write your code here
Solve this problem in your browser
Python runs in your browser and checks your answer right away. Hints and the answer are on the problem page.