Two stacked charts that share only the x-axis
Write code · Medium · §3.3 Shared axes and fair comparisons
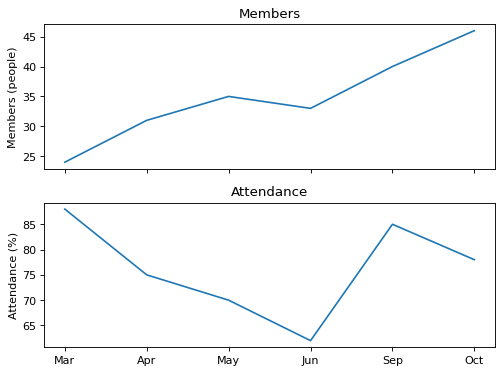
Draw a photo club's monthly membership (people) and meeting attendance rate (%) as line charts on two Axes, one above the other. Draw members on the top Axes and attendance on the bottom Axes.
The titles are Members on top and Attendance below. Put units in the y-axis labels: Members (people) on top and Attendance (%) below.
Make the two Axes share the x-axis so that you can read the same month on both, one above the other. The two measures have different units, so they do not share the y-axis.
Starter code
import matplotlib.pyplot as plt

months = ["Mar", "Apr", "May", "Jun", "Sep", "Oct"]
members = [24, 31, 35, 33, 40, 46]
attendance = [88, 75, 70, 62, 85, 78]

# Write your code here
Solve this problem in your browser
Python runs in your browser and checks your answer right away. Hints and the answer are on the problem page.