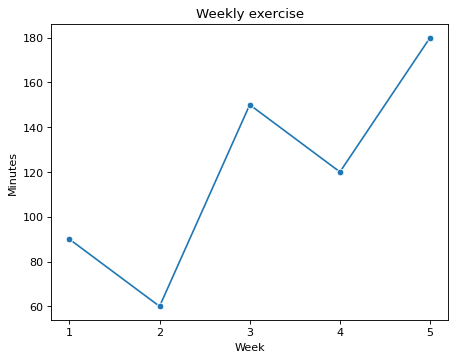
An exercise line chart with ticks only at week numbers
Fill in the blanks · Basic · §4.1 Mapping table columns to a chart
The DataFrame log holds a student's exercise records for 5 weeks. Fill in the first two blanks with column names, written as strings in quotes, so that the week number goes on the x-axis and the minutes of exercise in that week go on the y-axis. The DataFrame also has a column for the number of workouts, so choose the column names carefully.
Matplotlib picks the x-axis tick positions on its own, so if you leave it as is, ticks also appear at places with no record, such as 1.5. Fill in the last blank so that ticks appear only at the week numbers in the DataFrame.
Code with blanks
import pandas as pd
import seaborn as sns
import matplotlib.pyplot as plt

log = pd.DataFrame({
    "week": [1, 2, 3, 4, 5],
    "sessions": [3, 2, 4, 4, 5],
    "minutes": [90, 60, 150, 120, 180],
})

fig, ax = plt.subplots()
sns.lineplot(data=log, x=____, y=____, marker="o", ax=ax)
ax.set(title="Weekly exercise", xlabel="Week", ylabel="Minutes")
ax.set_xticks(____)
plt.show()
Solve this problem in your browser
Python runs in your browser and checks your answer right away. Hints and the answer are on the problem page.