A classroom temperature line chart from DataFrame columns
Write code · Basic · §4.1 Mapping table columns to a chart
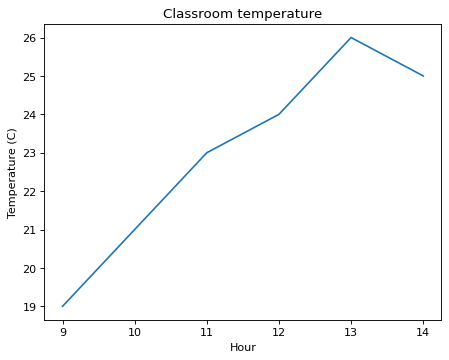
The DataFrame room holds classroom temperatures measured every hour from 9 a.m. to 2 p.m. Draw a line chart by passing the DataFrame and column names to seaborn's lineplot(). Put the hour column on the x-axis and the temp column on the y-axis.
Make the Axes to draw on with fig, ax = plt.subplots() and pass it in. Set the title to Classroom temperature, the x-axis label to Hour, and the y-axis label to Temperature (C).
Starter code
import pandas as pd
import seaborn as sns
import matplotlib.pyplot as plt

hours = [9, 10, 11, 12, 13, 14]
temps = [19, 21, 23, 24, 26, 25]
room = pd.DataFrame({"hour": hours, "temp": temps})

# Write your code here
Solve this problem in your browser
Python runs in your browser and checks your answer right away. Hints and the answer are on the problem page.