Saving a bar chart of movies by genre at a set pixel size
Write code · Medium · §4.3 Arranging charts and saving results
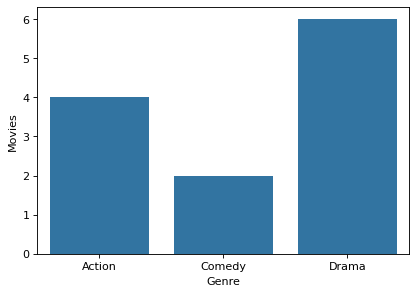
The DataFrame movies lists the movies that students in a class watched, one movie per row. Use seaborn's countplot() to draw bars showing how many movies there are in each genre. Put the bars in the order Action, Comedy, Drama, and set the x-axis label to Genre and the y-axis label to Movies.
Save the figure as genre_counts.png, with just the file name and no folder. Choose the figure size (figsize) so that the PNG saved with dpi=150 is 900 pixels wide and 600 pixels tall. bbox_inches="tight" trims the margins and changes the number of pixels, so do not use it in this problem.
Starter code
import pandas as pd
import seaborn as sns
import matplotlib.pyplot as plt

genres = ["Drama", "Action", "Drama", "Comedy", "Action", "Drama", "Action", "Drama", "Comedy", "Drama", "Action", "Drama"]
ratings = [8, 7, 9, 6, 8, 7, 5, 9, 7, 8, 6, 9]
movies = pd.DataFrame({"genre": genres, "rating": ratings})

# Write your code here
Solve this problem in your browser
Python runs in your browser and checks your answer right away. Hints and the answer are on the problem page.