Sharing an axis between visitor lines and stay bars
Fill in the blanks · Medium · §4.3 Arranging charts and saving results
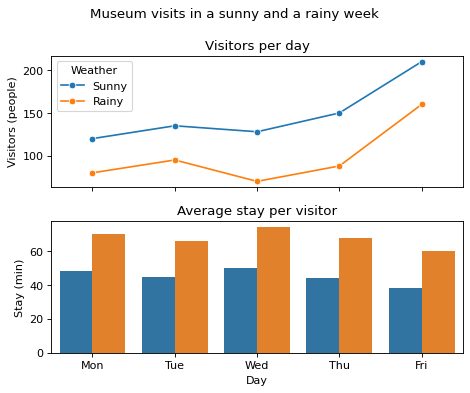
The long-format DataFrame visits holds a museum's records for a sunny week and a rainy week. visitors is the number of visitors that day (people), and stay is the average time visitors stayed (minutes). Make a figure with two Axes, one above the other. On the top Axes, draw lines of visitors by day for each kind of weather; on the bottom Axes, draw bars of the length of stay by day for each kind of weather.
Make the two Axes share only the axis that means the same thing in both. Look at what the x-axis and y-axis of each chart show, and choose the axis to share. Fill in the four blanks. In the first blank, write the number of rows and columns together, and in the second blank, write the argument that sets which axis to share.
Code with blanks
import pandas as pd
import seaborn as sns
import matplotlib.pyplot as plt

visits = pd.DataFrame({
    "day": ["Mon", "Tue", "Wed", "Thu", "Fri"] * 2,
    "weather": ["Sunny"] * 5 + ["Rainy"] * 5,
    "visitors": [120, 135, 128, 150, 210, 80, 95, 70, 88, 160],
    "stay": [48, 45, 50, 44, 38, 70, 66, 74, 68, 60],
})

fig, axes = plt.subplots(____, ____, figsize=(6, 5))
sns.lineplot(data=visits, x="day", y="visitors", hue="weather", marker="o", ax=____)
# Bar colors match the weather legend above, so only the top Axes gets a legend
sns.barplot(data=visits, x="day", y="stay", hue="weather", errorbar=None, legend=False, ax=____)
axes[0].set(title="Visitors per day", ylabel="Visitors (people)")
axes[0].legend(title="Weather")
axes[1].set(title="Average stay per visitor", xlabel="Day", ylabel="Stay (min)")
fig.suptitle("Museum visits in a sunny and a rainy week")
fig.tight_layout()
plt.show()
Solve this problem in your browser
Python runs in your browser and checks your answer right away. Hints and the answer are on the problem page.