Fixing the panel titles and the left panel of a FacetGrid
Fill in the blanks · Medium · §5.3 Facets and returned objects
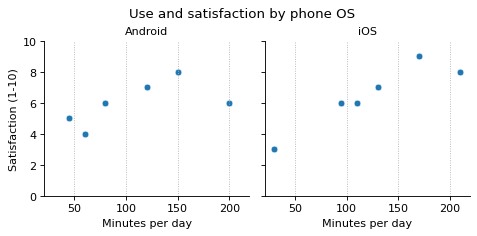
Use the FacetGrid facets that relplot() returned to adjust the scatter plots for each operating system. The given code already sets the x-axis label, the y-axis range, the vertical grid lines, and the figure title.
Fill in the two blanks so that the panel titles show only the operating system names (Android, iOS), and select just the left panel to add the y-axis label Satisfaction (1-10).
Code with blanks
import pandas as pd
import seaborn as sns
import matplotlib.pyplot as plt

survey = pd.DataFrame({
    "minutes": [45, 80, 120, 150, 200, 60, 95, 130, 170, 210, 30, 110],
    "satisfaction": [5, 6, 7, 8, 6, 4, 6, 7, 9, 8, 3, 6],
    "os": ["Android"] * 6 + ["iOS"] * 6,
})

facets = sns.relplot(data=survey, x="minutes", y="satisfaction", col="os", kind="scatter", height=3)
facets.set_titles(____)
facets.set(xlabel="Minutes per day", ylim=(0, 10))
____.set_ylabel("Satisfaction (1-10)")
for panel in facets.axes.flat:
    panel.grid(axis="x", linestyle=":")
facets.figure.suptitle("Use and satisfaction by phone OS")
facets.figure.subplots_adjust(top=0.84)
plt.show()
Solve this problem in your browser
Python runs in your browser and checks your answer right away. Hints and the answer are on the problem page.