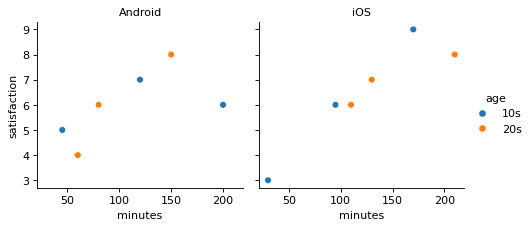
A scatter plot split into panels by OS
Write code · Medium · §5.3 Facets and returned objects
The DataFrame survey holds the daily usage time (minutes) and the satisfaction score (satisfaction) of 12 app users. Use seaborn's relplot() to make one panel for each operating system (os), placed side by side, and draw a scatter plot of usage time (x-axis) and satisfaction (y-axis) in each panel.
Color the points by age group (age), with 10s and then 20s in the legend, and make the panel titles show only the operating system names (Android, iOS).
Starter code
import pandas as pd
import seaborn as sns
import matplotlib.pyplot as plt

survey = pd.DataFrame({
    "minutes": [45, 80, 120, 150, 200, 60, 95, 130, 170, 210, 30, 110],
    "satisfaction": [5, 6, 7, 8, 6, 4, 6, 7, 9, 8, 3, 6],
    "os": ["Android"] * 6 + ["iOS"] * 6,
    "age": ["10s", "20s"] * 6,
})

# Write your code here
Solve this problem in your browser
Python runs in your browser and checks your answer right away. Hints and the answer are on the problem page.