A draft that drew multiple-response answers as a pie chart
Code review · Medium · §5.5 Reviewing and reading your chart choice
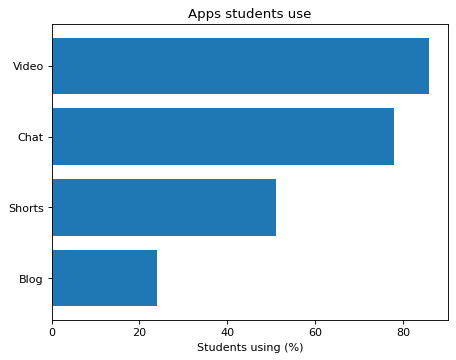
A survey asked students to choose all the apps they use. percent is the share (%) of respondents who said they use that app, so one student can count toward several apps, and the values add up to more than 100. An AI draft drew these values as a pie chart.
Change the pie chart into a horizontal bar chart whose bar lengths are the percent values as they are, and add the x-axis label Students using (%). The DataFrame lists the apps starting from the one with the fewest users, so pass them to barh() in the DataFrame's order to put the most-used app at the top. Keep the title as it is.
Code to fix
import pandas as pd
import matplotlib.pyplot as plt

apps = pd.DataFrame({
    "app": ["Blog", "Shorts", "Chat", "Video"],
    "percent": [24, 51, 78, 86],
})
fig, ax = plt.subplots()
ax.pie(apps["percent"], labels=apps["app"], autopct="%1.0f%%")
ax.set_title("Apps students use")
plt.show()
Solve this problem in your browser
Python runs in your browser and checks your answer right away. Hints and the answer are on the problem page.