A draft that chose bars for a relationship question
Code review · Basic · §5.5 Reviewing and reading your chart choice
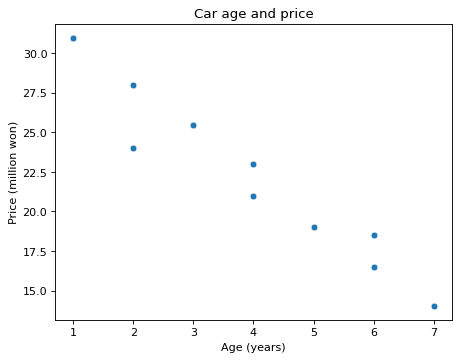
You asked an AI for a chart that answers "Do older used cars cost less?" and got the code below. It runs, but the chart it chose does not fit the question.
The question asks about the relationship between two values, car age and price. Change one line to turn the bar chart into a chart where each car is one point. Keep the title and the axis labels as they are.
Code to fix
import pandas as pd
import seaborn as sns
import matplotlib.pyplot as plt

cars = pd.DataFrame({
    "age": [1, 2, 2, 3, 4, 4, 5, 6, 6, 7],
    "price": [31.0, 28.0, 24.0, 25.5, 21.0, 23.0, 19.0, 16.5, 18.5, 14.0],
})
fig, ax = plt.subplots()
sns.barplot(data=cars, x="age", y="price", ax=ax)
ax.set(title="Car age and price", xlabel="Age (years)", ylabel="Price (million won)")
plt.show()
Solve this problem in your browser
Python runs in your browser and checks your answer right away. Hints and the answer are on the problem page.