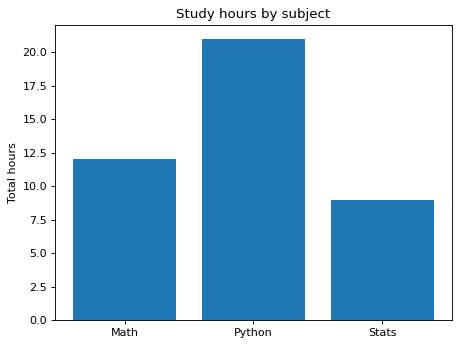
A bar chart of total study hours by subject
Write code · Medium · §5.1 Checking the question and the data
The long-format DataFrame study holds study hours over three weeks. Each row is the hours for one subject in one week. So that you can compare which subject got the most study time, draw a bar chart of the total hours for each subject over the three weeks.
Place the bars in alphabetical order of subject name (Math, Python, Stats). Set the title to Study hours by subject and the y-axis label to Total hours.
Starter code
import pandas as pd
import seaborn as sns
import matplotlib.pyplot as plt

study = pd.DataFrame({
    "week": [1, 1, 1, 2, 2, 2, 3, 3, 3],
    "subject": ["Math", "Python", "Stats"] * 3,
    "hours": [4, 6, 3, 5, 7, 2, 3, 8, 4],
})

# Write your code here
Solve this problem in your browser
Python runs in your browser and checks your answer right away. Hints and the answer are on the problem page.