A scatter plot colored by study method
Write code · Basic · §5.2 Scatter plots and groups
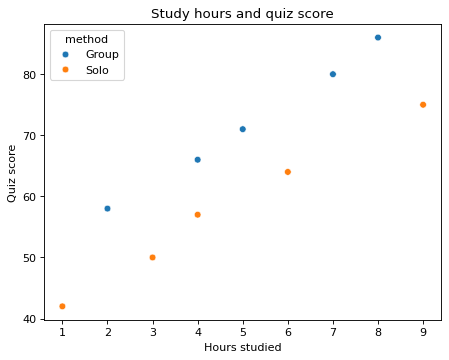
The DataFrame quiz holds the study hours and quiz scores of 10 students. Use seaborn's scatterplot() to put hours on the x-axis and score on the y-axis, and color the points by study method (method). The legend shows Group first, then Solo.
Set the title to Study hours and quiz score, the x-axis label to Hours studied, and the y-axis label to Quiz score.
Starter code
import pandas as pd
import seaborn as sns
import matplotlib.pyplot as plt

quiz = pd.DataFrame({
    "hours": [2, 4, 5, 7, 8, 1, 3, 4, 6, 9],
    "score": [58, 66, 71, 80, 86, 42, 50, 57, 64, 75],
    "method": ["Group"] * 5 + ["Solo"] * 5,
})

# Write your code here
Solve this problem in your browser
Python runs in your browser and checks your answer right away. Hints and the answer are on the problem page.