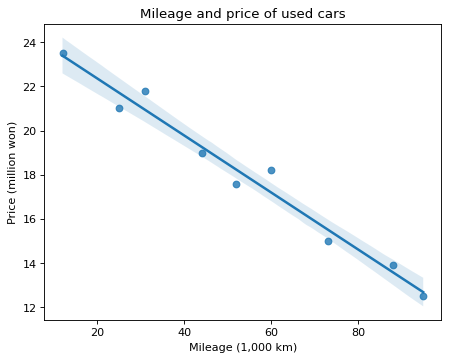
A trend line for the mileage and price of used cars
Write code · Medium · §5.2 Scatter plots and groups
The DataFrame cars holds the mileage (mileage, in 1,000 km) and the price (price, in million won) of 9 used cars. Use seaborn's regplot() to draw a scatter plot with mileage on the x-axis and price on the y-axis, together with a trend line.
Set the title to Mileage and price of used cars, the x-axis label to Mileage (1,000 km), and the y-axis label to Price (million won).
Starter code
import pandas as pd
import seaborn as sns
import matplotlib.pyplot as plt

cars = pd.DataFrame({
    "mileage": [12, 25, 31, 44, 52, 60, 73, 88, 95],
    "price": [23.5, 21.0, 21.8, 19.0, 17.6, 18.2, 15.0, 13.9, 12.5],
})

# Write your code here
Solve this problem in your browser
Python runs in your browser and checks your answer right away. Hints and the answer are on the problem page.