A highlighted line covered in gray
Code review · Medium · §6.1 Diagnosing before polishing
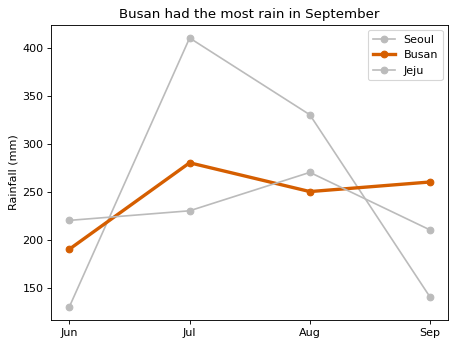
You are polishing a line chart of June–September rainfall in three cities. The goal was to highlight only the Busan line, which the title is about, in orange #D55E00, and to push the other two cities into the background in gray #BBBBBB. But when you run the code, all three lines are gray.
Change two lines of code so that only the Busan line is orange. Keep the values, the order in which the lines are drawn, the title, and the legend as they are.
Code to fix
import matplotlib.pyplot as plt

months = ["Jun", "Jul", "Aug", "Sep"]
rain = {
    "Seoul": [130, 410, 330, 140],
    "Busan": [190, 280, 250, 260],
    "Jeju": [220, 230, 270, 210],
}

fig, ax = plt.subplots()
for city, values in rain.items():
    ax.plot(months, values, marker="o", label=city)
ax.lines[2].set(color="#D55E00", linewidth=3)
for line in ax.lines:
    line.set(color="#BBBBBB")
ax.set_title("Busan had the most rain in September")
ax.set_ylabel("Rainfall (mm)")
ax.legend()
plt.show()
Solve this problem in your browser
Python runs in your browser and checks your answer right away. Hints and the answer are on the problem page.