A color dictionary that fixes each city's color
Write code · Medium · §6.2 Colors, lines, and markers
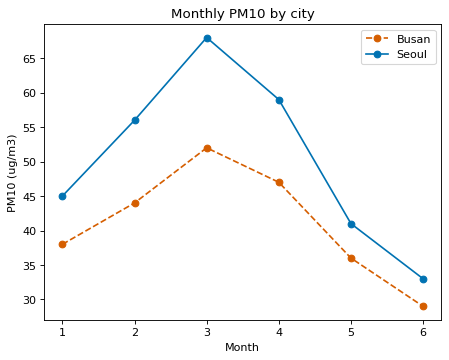
Draw a line chart of the monthly average particulate matter (PM10) level by city. You draw one line per city with for city, part in dust.groupby("city"):, so the lines are drawn in the order that groupby() returns the groups (alphabetical order of city names). Get each color from the color dictionary city_colors by city name.
So that the lines can be told apart even when printed without color, draw Seoul with a solid line and the other cities with dashed lines ("--"). Add circle markers ("o") to all lines, label each line with its city name, and show the legend. Set the title to Monthly PM10 by city, the x-axis label to Month, and the y-axis label to PM10 (ug/m3).
Starter code
import matplotlib.pyplot as plt
import pandas as pd

dust = pd.DataFrame({
    "month": [1, 2, 3, 4, 5, 6] * 2,
    "city": ["Busan"] * 6 + ["Seoul"] * 6,
    "pm10": [38, 44, 52, 47, 36, 29, 45, 56, 68, 59, 41, 33],
})
city_colors = {"Seoul": "#0072B2", "Busan": "#D55E00", "Gwangju": "#009E73"}

# Write your code here
Solve this problem in your browser
Python runs in your browser and checks your answer right away. Hints and the answer are on the problem page.