Readable tick labels on a log axis
Write code · Challenge · §6.3 Axes, ticks, and units
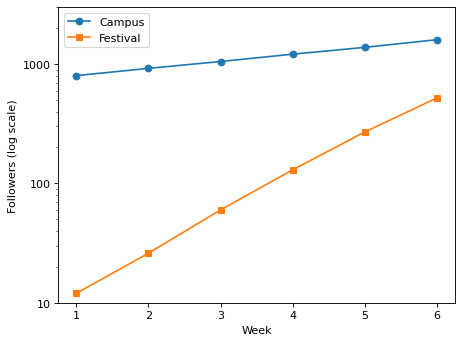
Draw the weekly follower counts of the university's main social media account (campus) and a newly opened festival account (festival) as two lines on one Axes. Draw campus first and festival next, label them Campus and Festival, and show the legend.
To compare how many times larger the counts became, change the y-axis to a log scale. Set the y-axis range to 10–3000, and place the labeled ticks (major ticks) only at 10, 100, and 1000, with the tick labels 10, 100, and 1000. Set the x-axis label to Week, and make the y-axis label Followers (log scale) to show that it is a log axis.
Starter code
import matplotlib.pyplot as plt

weeks = [1, 2, 3, 4, 5, 6]
campus = [800, 920, 1050, 1210, 1380, 1600]
festival = [12, 26, 60, 130, 270, 520]

# Write your code here
Solve this problem in your browser
Python runs in your browser and checks your answer right away. Hints and the answer are on the problem page.