Tick labels in milliseconds
Write code · Medium · §6.3 Axes, ticks, and units
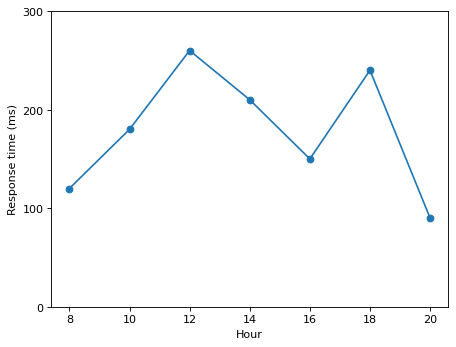
Draw a line chart of a web server's average response time by hour. The data resp_s is in seconds, and you draw it as it is without changing it. Instead, write the y-axis tick labels in milliseconds (ms).
Set the y-axis range to 0–0.3 seconds, place a tick every 0.1 seconds, and write each tick label as the value times 1000, as a whole number (0, 100, 200, 300). Set the x-axis label to Hour and the y-axis label to Response time (ms). There is only one line, so do not add a line label or a legend.
Starter code
import matplotlib.pyplot as plt
from matplotlib.ticker import MultipleLocator, FuncFormatter

hours = [8, 10, 12, 14, 16, 18, 20]
resp_s = [0.12, 0.18, 0.26, 0.21, 0.15, 0.24, 0.09]  # response time (seconds)

# Write your code here
Solve this problem in your browser
Python runs in your browser and checks your answer right away. Hints and the answer are on the problem page.