An annotation on the peak found in the DataFrame
Write code · Medium · §6.4 Annotations and reference lines
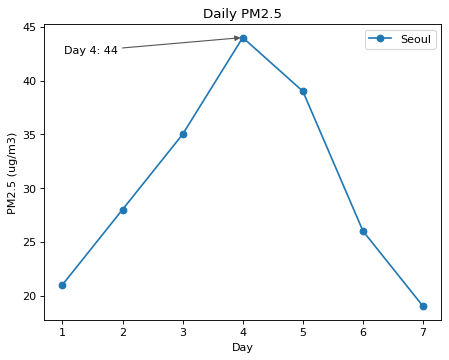
One DataFrame, dust, holds the daily average fine particulate matter (PM2.5) levels of two cities, and the Seoul rows have already been selected into seoul. Draw a line chart of Seoul's level (pm25) by day (day), label the line Seoul, and show the legend. Then add an arrow annotation to the point of the day with the highest level.
Write the day and the level in the annotation text, as in Day 4: 44. Calculate the day and the level from the DataFrame. Set the title to Daily PM2.5, the x-axis label to Day, and the y-axis label to PM2.5 (ug/m3). Do not put any other text inside the chart besides this annotation.
Starter code
import matplotlib.pyplot as plt
import pandas as pd

dust = pd.DataFrame({
    "day": [1, 2, 3, 4, 5, 6, 7] * 2,
    "city": ["Busan"] * 7 + ["Seoul"] * 7,
    "pm25": [18, 22, 25, 31, 27, 20, 16, 21, 28, 35, 44, 39, 26, 19],
})
seoul = dust[dust["city"] == "Seoul"]

# Write your code here
Solve this problem in your browser
Python runs in your browser and checks your answer right away. Hints and the answer are on the problem page.