A capacity reference line and sections over capacity
Write code · Medium · §6.4 Annotations and reference lines
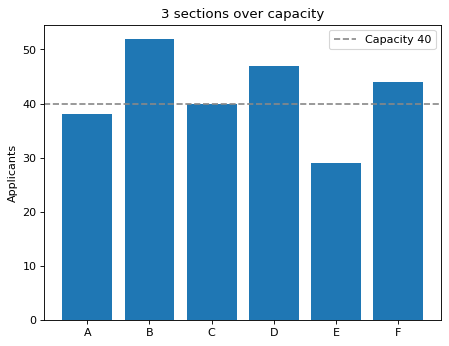
Draw a bar chart of the number of students who applied to each section of a general education course, and draw a reference line across the Axes at the height of the capacity cap. The reference line is a gray ("#888888") dashed line ("--"). Give it a label that includes the capacity, as in Capacity 40, and show the legend.
In the title, put the number of sections where the applicants went over capacity (more than the capacity), as in 3 sections over capacity. Calculate the capacity and the number of sections from cap and applied. Set the y-axis label to Applicants. Do not label the bars, so that only the reference line appears in the legend.
Starter code
import matplotlib.pyplot as plt

sections = ["A", "B", "C", "D", "E", "F"]
applied = [38, 52, 40, 47, 29, 44]
cap = 40

# Write your code here
Solve this problem in your browser
Python runs in your browser and checks your answer right away. Hints and the answer are on the problem page.