Adjusting facets the FacetGrid way
Fill in the blanks · Medium · §7.3 Layout and returned objects
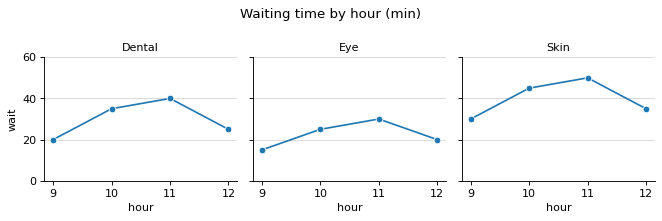
The average waiting time (minutes) by hour at three hospital clinics was drawn with sns.relplot(), one panel per clinic. Fill in the blanks so that the code adjusts the FacetGrid g that the function returned and does the following four things.
Show only the clinic name in each panel title, like Dental, and set the y-axis range of all three panels to 0 to 60 at once.
Draw a light horizontal grid in each panel, and add the figure title Waiting time by hour (min).
Code with blanks
import matplotlib.pyplot as plt
import pandas as pd
import seaborn as sns

hours = [9, 10, 11, 12] * 3
clinics = ["Dental"] * 4 + ["Eye"] * 4 + ["Skin"] * 4
waits = [20, 35, 40, 25, 15, 25, 30, 20, 30, 45, 50, 35]
df = pd.DataFrame({"hour": hours, "clinic": clinics, "wait": waits})

g = sns.relplot(data=df, x="hour", y="wait", col="clinic", kind="line", marker="o", height=2.8)
g.____("{col_name}")
g.____(ylim=(0, 60))
for ax in ____:
    ax.grid(axis="y", alpha=0.5)
____.suptitle("Waiting time by hour (min)")
g.tight_layout()
Solve this problem in your browser
Python runs in your browser and checks your answer right away. Hints and the answer are on the problem page.