Two seaborn panels adjusted through the returned Axes
Write code · Medium · §7.3 Layout and returned objects
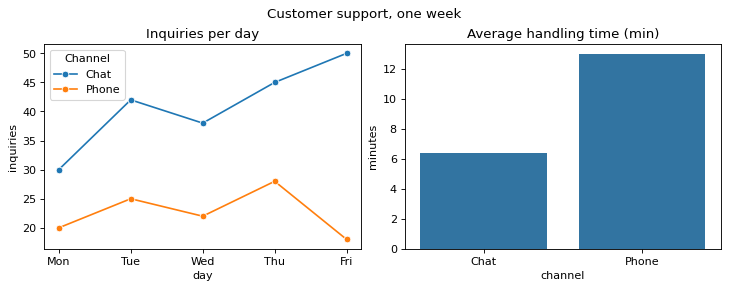
Draw a week of customer support records on two Axes in 1 row and 2 columns. Use the fig and axes that the starter code made as they are.
On the left Axes, draw the number of inquiries by day with sns.lineplot(), one line per channel (hue="channel"), and set the title to Inquiries per day. Change the title of the legend that seaborn adds to Channel.
On the right Axes, draw the average handling time by channel with sns.barplot() without error bars (errorbar=None), and set the title to Average handling time (min).
The figure title is Customer support, one week.
Starter code
import matplotlib.pyplot as plt
import pandas as pd
import seaborn as sns

days = ["Mon", "Tue", "Wed", "Thu", "Fri"] * 2
channels = ["Chat"] * 5 + ["Phone"] * 5
inquiries = [30, 42, 38, 45, 50, 20, 25, 22, 28, 18]
minutes = [6, 7, 5, 8, 6, 12, 14, 11, 13, 15]
support = pd.DataFrame({"day": days, "channel": channels, "inquiries": inquiries, "minutes": minutes})

fig, axes = plt.subplots(1, 2, figsize=(9, 3.5), layout="constrained")
# Write your code here
Solve this problem in your browser
Python runs in your browser and checks your answer right away. Hints and the answer are on the problem page.