Splitting a dual y-axis draft into two panels
Code review · Medium · §7.4 Reusing styles and reviewing AI drafts
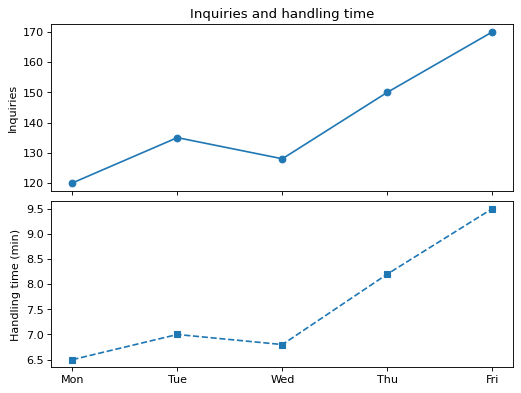
This AI draft overlays the number of inquiries and the average handling time (minutes) by day on one Axes with a dual y-axis (twinx()). Where the two lines meet or pass each other depends on how the range of the right y-axis is set, so it means nothing.
Change two lines of code to split the chart into two panels, one above the other (2 rows, 1 column), and share only the x-axis so the days line up. Put the inquiries in the top panel and the handling time in the bottom panel, and keep the y-axis labels and the title as they are.
Code to fix
import matplotlib.pyplot as plt

days = ["Mon", "Tue", "Wed", "Thu", "Fri"]
inquiries = [120, 135, 128, 150, 170]
minutes = [6.5, 7.0, 6.8, 8.2, 9.5]

fig, ax = plt.subplots()
ax.plot(days, inquiries, marker="o")
ax.set_ylabel("Inquiries")
ax2 = ax.twinx()
ax2.plot(days, minutes, marker="s", linestyle="--")
ax2.set_ylabel("Handling time (min)")
ax.set_title("Inquiries and handling time")
plt.show()
Solve this problem in your browser
Python runs in your browser and checks your answer right away. Hints and the answer are on the problem page.