A one-page report that answers two questions
Write code · Challenge · §7.5 A one-page report and peer review
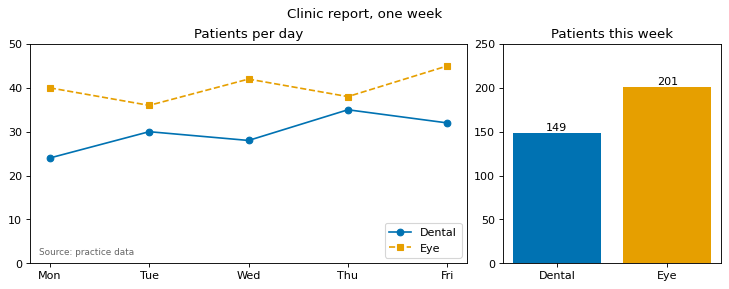
Make a one-page report from the number of patients seen at two clinics (Dental, Eye) over one week. The plt.subplot_mosaic() in the starter code makes a wide panel axd["daily"] on the left and a narrow panel axd["week"] on the right.
The left panel answers "How did the numbers change from day to day?" Draw dental first and eye next as lines, and add a legend with the line labels Dental and Eye. The title is Patients per day, and the y-axis range is 0 to 50.
The right panel answers "Which clinic saw more patients over the whole week?" Draw the weekly total for each clinic as vertical bars in the order Dental, Eye, and add value labels above the bars with bar_label(). The title is Patients this week, and the y-axis range is 0 to 250.
Color each clinic with the same color from colors in both panels. If you draw the bars with seaborn, pass saturation=1 so the colors do not fade. The figure title is Clinic report, one week.
Write the source line Source: practice data in the lower-left corner inside the left panel, and save the figure as clinic_report.pdf.
Starter code
import matplotlib.pyplot as plt

days = ["Mon", "Tue", "Wed", "Thu", "Fri"]
dental = [24, 30, 28, 35, 32]
eye = [40, 36, 42, 38, 45]
colors = {"Dental": "#0072B2", "Eye": "#E69F00"}

fig, axd = plt.subplot_mosaic([["daily", "daily", "week"]], figsize=(9, 3.5), layout="constrained")
# Write your code here
Solve this problem in your browser
Python runs in your browser and checks your answer right away. Hints and the answer are on the problem page.