Reviewing the ranges, colors, and figure title of a colleague's report
Code review · Challenge · §7.5 A one-page report and peer review
Check a colleague's recycling report with the review checklist in §7.5. The report must meet the following standards.
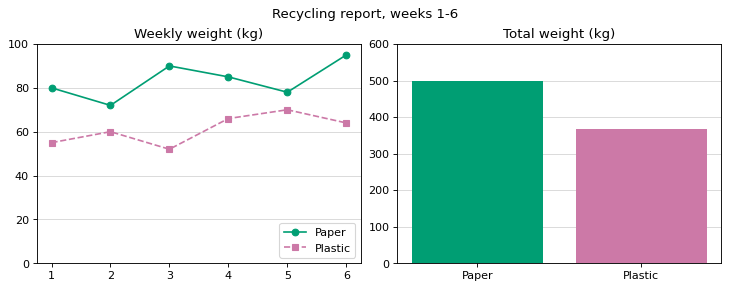
The left panel is a line chart of weekly weight by material, with the title Weekly weight (kg) and a y-axis from 0 to 100. The right panel is a bar chart of the six-week totals in the order Paper, Plastic, with the title Total weight (kg) and a y-axis from 0 to 600.
Both panels have a light horizontal grid, and each material has the same color as in colors in both panels. The figure title is Recycling report, weeks 1-6.
The code runs without errors, but it breaks these standards in three places. Fix them by changing or adding at most three lines.
Code to fix
import matplotlib.pyplot as plt

weeks = [1, 2, 3, 4, 5, 6]
paper = [80, 72, 90, 85, 78, 95]
plastic = [55, 60, 52, 66, 70, 64]
colors = {"Paper": "#009E73", "Plastic": "#CC79A7"}


def style_weekly(ax, title):
    # Settings for a weekly weight panel (0 to 100 kg)
    ax.set_title(title)
    ax.set_ylim(0, 100)
    ax.grid(axis="y", alpha=0.5)
    ax.set_axisbelow(True)


fig, axes = plt.subplots(1, 2, figsize=(9, 3.5), layout="constrained")
axes[0].plot(weeks, paper, marker="o", color=colors["Paper"], label="Paper")
axes[0].plot(weeks, plastic, marker="s", linestyle="--", color=colors["Plastic"], label="Plastic")
axes[0].legend(loc="lower right")
style_weekly(axes[0], "Weekly weight (kg)")

totals = {"Paper": sum(paper), "Plastic": sum(plastic)}
axes[1].bar(list(totals), list(totals.values()), color=["#CC79A7", "#009E73"])
style_weekly(axes[1], "Total weight (kg)")
plt.title("Recycling report, weeks 1-6")
plt.show()
Solve this problem in your browser
Python runs in your browser and checks your answer right away. Hints and the answer are on the problem page.