Direct labels at the ends of lines instead of a legend
Write code · Medium · §7.2 Legends, direct labels, and grids
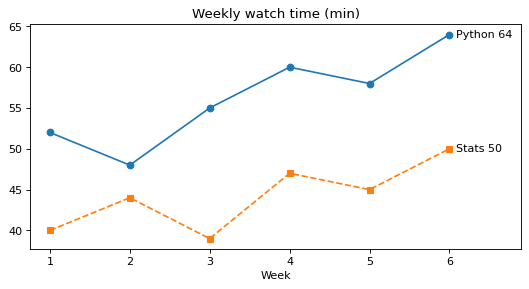
Draw two lines for the average weekly watch time (minutes) of two online courses. Draw python first with a solid line and circle markers (marker="o"), then stats with a dashed line (linestyle="--") and square markers (marker="s"). Give each line a label with its course name, Python or Stats.
Do not draw a legend. Instead, write the course name and the last week's value to the right of the last point of each line, like Python 64 and Stats 50. Take the values from the lists, and add the Python text first.
The title is Weekly watch time (min).
Starter code
import matplotlib.pyplot as plt

weeks = [1, 2, 3, 4, 5, 6]
python = [52, 48, 55, 60, 58, 64]
stats = [40, 44, 39, 47, 45, 50]

# Write your code here
Solve this problem in your browser
Python runs in your browser and checks your answer right away. Hints and the answer are on the problem page.