A legend outside the Axes so it does not hide the lines
Write code · Medium · §7.2 Legends, direct labels, and grids
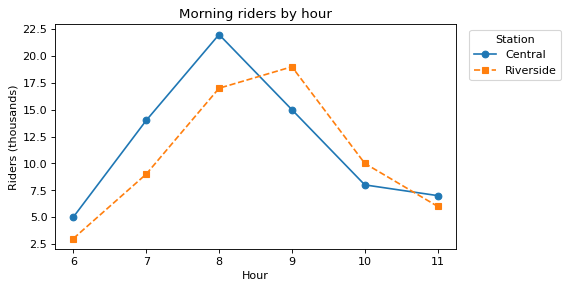
Draw two lines for the number of morning riders (thousands) by hour at two subway stations. Draw central first and riverside next, and label the lines Central and Riverside.
Give the legend the title Station, and place it outside the Axes on the right with bbox_to_anchor so it does not hide the lines.
The Axes title is Morning riders by hour, and the y-axis label is Riders (thousands).
Starter code
import matplotlib.pyplot as plt

hours = [6, 7, 8, 9, 10, 11]
central = [5, 14, 22, 15, 8, 7]
riverside = [3, 9, 17, 19, 10, 6]

# Write your code here
Solve this problem in your browser
Python runs in your browser and checks your answer right away. Hints and the answer are on the problem page.