A style function that gives three panels the same look
Write code · Medium · §7.4 Reusing styles and reviewing AI drafts
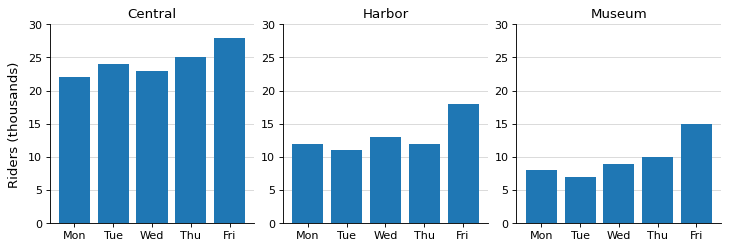
Draw the number of riders (thousands) by day of the week at three subway stations as vertical bar charts, one on each of three Axes in 1 row and 3 columns. From the left, they are central, harbor, and museum.
Complete the function style_riders(ax, title), which gives the three panels the same look, and call it for each panel. The function sets the title it receives as the panel title (Central, Harbor, Museum) and sets the y-axis range to 0 to 30.
In the same function, draw only light horizontal grid lines and hide the top and right spines.
Starter code
import matplotlib.pyplot as plt

days = ["Mon", "Tue", "Wed", "Thu", "Fri"]
central = [22, 24, 23, 25, 28]
harbor = [12, 11, 13, 12, 18]
museum = [8, 7, 9, 10, 15]


def style_riders(ax, title):
    # Write the settings for a riders panel (thousands, 0 to 30) here
    pass


# Draw your chart here
Solve this problem in your browser
Python runs in your browser and checks your answer right away. Hints and the answer are on the problem page.