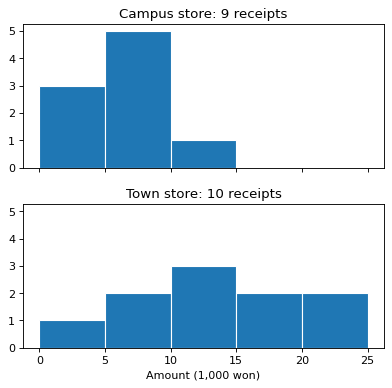
Two convenience store histograms lined up one above the other
Fill in the blanks · Basic · §8.2 Histogram bins
Compare receipt amounts (1,000 won) at a convenience store on campus (campus) and one in town (town) with two histograms, one above the other. Make the Axes in 2 rows and 1 column, and make the two Axes share both the x-axis and the y-axis. Split both stores' histograms with the same bin edges, edges. Fill in the three blanks: the numbers of rows and columns in the first, the arguments that share the axes in the second, and the bin edges in the third.
Code with blanks
import matplotlib.pyplot as plt

campus = [3, 4, 4, 5, 6, 6, 7, 9, 12]
town = [2, 5, 8, 10, 11, 13, 15, 18, 22, 25]
edges = [0, 5, 10, 15, 20, 25]

fig, axes = plt.subplots(____, ____, figsize=(5, 5))
for ax, amounts, name in zip(axes, [campus, town], ["Campus store", "Town store"]):
    ax.hist(amounts, bins=____, edgecolor="white")
    ax.set_title(f"{name}: {len(amounts)} receipts")
axes[1].set_xlabel("Amount (1,000 won)")
fig.tight_layout()
plt.show()
Solve this problem in your browser
Python runs in your browser and checks your answer right away. Hints and the answer are on the problem page.