Bin edges for a battery life histogram
Write code · Basic · §8.2 Histogram bins
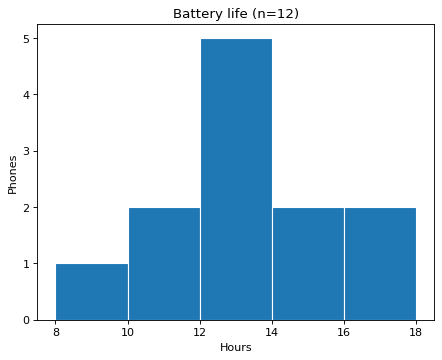
The list hours holds how many hours each of 12 phones lasted from a full charge until it shut off. Draw a histogram with bin edges every 2 hours from 8 to 18 hours (8, 10, …, 18).
Put the number of observations in the title, like Battery life (n=12), set the x-axis label to Hours, and set the y-axis label to Phones. Grading redraws the chart with different values in hours.
Starter code
import matplotlib.pyplot as plt
import numpy as np

hours = [11, 13, 9, 12, 14, 15, 12, 10, 13, 17, 12, 18]

# Write your code here
Solve this problem in your browser
Python runs in your browser and checks your answer right away. Hints and the answer are on the problem page.