Mean bars that do not fit the question
Code review · Basic · §8.5 Choosing a chart and reporting a distribution
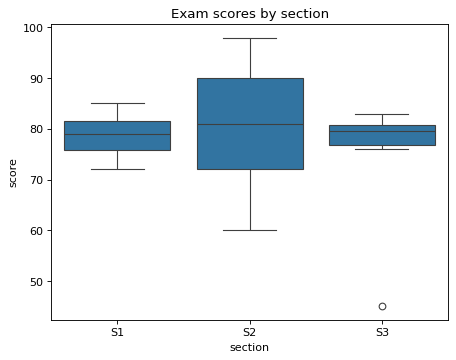
The question is "How do the median and the spread of exam scores differ by section?" The AI draft draws a bar of the mean for each section, so the spread and the scores far from the rest do not show.
Change one line so that the code draws a box plot for each section. Let the box plot mark scores beyond the whiskers as points.
Code to fix
import matplotlib.pyplot as plt
import pandas as pd
import seaborn as sns

sections = ["S1"] * 6 + ["S2"] * 6 + ["S3"] * 6
scores = [72, 75, 78, 80, 82, 85, 60, 70, 78, 84, 92, 98, 79, 45, 83, 76, 81, 80]
exam = pd.DataFrame({"section": sections, "score": scores})

fig, ax = plt.subplots()
sns.barplot(data=exam, x="section", y="score", errorbar=None, ax=ax)
ax.set_title("Exam scores by section")
plt.show()
Solve this problem in your browser
Python runs in your browser and checks your answer right away. Hints and the answer are on the problem page.