A distribution report with density curves and raw data points
Write code · Challenge · §8.5 Choosing a chart and reporting a distribution
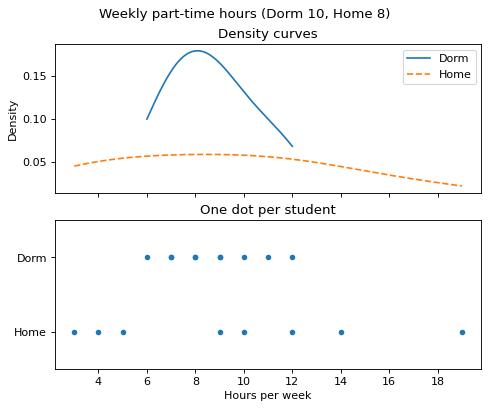
Make a one-page distribution report on how many hours a week students worked part-time, for students who live in the dorm (dorm) and students who commute from home (home). Make Axes in 2 rows and 1 column so that the two Axes share the x-axis, and put the unit and the numbers of observations in the figure title, like Weekly part-time hours (Dorm 10, Home 8).
On the top Axes, overlay the density curves of the two groups with seaborn's kdeplot() and cut=0. Draw dorm first as a solid line and home next as a dashed line (linestyle="--"), and show a legend with the labels Dorm and Home. The title is Density curves.
On the bottom Axes, plot one dot per student. Put the part-time hours on the x-axis and the group names (Dorm, Home) on the y-axis, and plot dorm first. To keep the dots from being jittered (shifted slightly at random), pass jitter=False to seaborn's stripplot(), or plot them with Matplotlib's scatter(). The title is One dot per student, and only the top Axes has a legend.
The x-axis label that states the unit (Hours per week) is not graded. Grading redraws the charts with different values in dorm and home.
Starter code
import matplotlib.pyplot as plt
import seaborn as sns

dorm = [6, 7, 7, 8, 8, 9, 9, 10, 11, 12]
home = [3, 4, 5, 9, 10, 12, 14, 19]

# Write your code here
Solve this problem in your browser
Python runs in your browser and checks your answer right away. Hints and the answer are on the problem page.