Wait time densities for two rides with different numbers of records
Write code · Medium · §8.3 Comparing groups by density
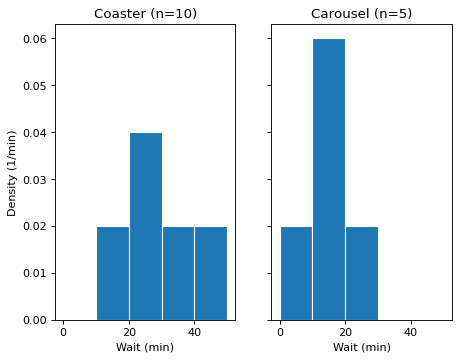
These are wait times (minutes) measured at two rides in an amusement park. The roller coaster (coaster) was recorded 10 times and the carousel (carousel) 5 times, so it is hard to compare the shapes using counts. Make two Axes in 1 row and 2 columns that share the y-axis, and draw the histograms of the two rides as densities with the same bin edges, edges. coaster goes on the left and carousel on the right.
A density does not show the number of observations, so put it in the titles, like Coaster (n=10) and Carousel (n=5). The axis labels that state the units (Wait (min), Density (1/min)) are not graded. Grading redraws the charts with different values in coaster and carousel.
Starter code
import matplotlib.pyplot as plt

coaster = [13, 18, 21, 23, 25, 27, 30, 34, 41, 46]
carousel = [9, 12, 15, 17, 24]
edges = [0, 10, 20, 30, 40, 50]

# Write your code here
Solve this problem in your browser
Python runs in your browser and checks your answer right away. Hints and the answer are on the problem page.