Density step lines with the area scaled for each section
Write code · Medium · §8.3 Comparing groups by density
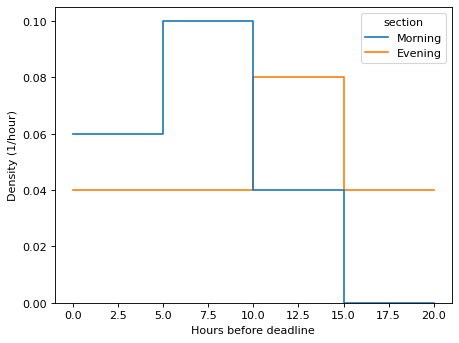
The DataFrame subs records how many hours before the deadline the students in two class sections turned in an assignment. The morning section (Morning) has 10 students, and the evening section (Evening) has 5. Call seaborn's histplot() only once, split the sections with hue, and overlay the densities of the two sections on one Axes as step lines (element="step", fill=False).
The bin edges are edges. Scale the densities so that the area adds up to 1 for each section. The legend is in the order Morning, Evening. The axis labels that state the units (Hours before deadline, Density (1/hour)) are not graded.
Starter code
import matplotlib.pyplot as plt
import pandas as pd
import seaborn as sns

sections = ["Morning"] * 10 + ["Evening"] * 5
hours = [2, 3, 4, 5, 6, 7, 8, 9, 11, 14, 1, 6, 12, 13, 18]
subs = pd.DataFrame({"section": sections, "hours": hours})
edges = [0, 5, 10, 15, 20]

# Write your code here
Solve this problem in your browser
Python runs in your browser and checks your answer right away. Hints and the answer are on the problem page.