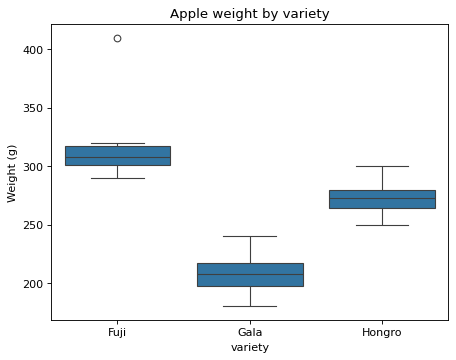
A box plot of apple weights by variety
Write code · Basic · §8.4 Box plots and possible outliers
The DataFrame apples holds the weights (g) of 18 apples picked at an orchard, along with their varieties. Draw a box plot for each variety to compare the medians and spreads. Put the boxes in the order Fuji, Gala, Hongro, set the y-axis label to Weight (g), and set the title to Apple weight by variety.
Let the box plot mark values beyond the whiskers as points.
Starter code
import matplotlib.pyplot as plt
import pandas as pd
import seaborn as sns

varieties = ["Fuji"] * 6 + ["Gala"] * 6 + ["Hongro"] * 6
grams = [305, 290, 320, 410, 300, 310, 210, 195, 240, 205, 220, 180, 270, 250, 281, 262, 300, 275]
apples = pd.DataFrame({"variety": varieties, "grams": grams})

# Write your code here
Solve this problem in your browser
Python runs in your browser and checks your answer right away. Hints and the answer are on the problem page.