A parking time histogram that leaves out records to check
Write code · Medium · §8.5 Choosing a chart and reporting a distribution
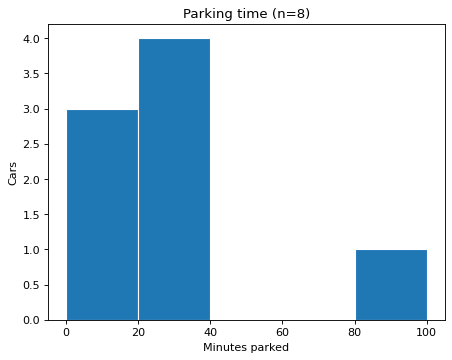
The DataFrame parking records how long (minutes) each car stayed in a campus parking lot, from coming in to leaving. Empty values (missing, NaN) and values below 0 are records whose originals need to be checked again, so leave them out of this chart. Keep 0 minutes.
Draw a histogram of the remaining records with the bin edges edges, and put the number of remaining records in the title, like Parking time (n=8). A large value such as 95 minutes is only a possible outlier to check, so keep it. The axis labels that state the units (Minutes parked, Cars) are not graded. Grading redraws the chart with different records.
Starter code
import matplotlib.pyplot as plt
import numpy as np
import pandas as pd

parking = pd.DataFrame({"minutes": [12, 25, np.nan, 18, -5, 30, 22, 95, 15, 28]})
edges = [0, 20, 40, 60, 80, 100]

# Write your code here
Solve this problem in your browser
Python runs in your browser and checks your answer right away. Hints and the answer are on the problem page.